Arrow Icon
Back to BlogSync

FREE Table Chart Maker

Create snazzy table charts in minutes

Build beautiful, responsive HTML tables and turn your data into stunning charts — all in one tool. No coding or design skills needed.

Create beautiful tables & charts with EasyTABLE
Icon
Fully customizable

Control fonts, colors, borders, alignment, striping, and more.

Icon
Import your data

Bring in data from CSV, Excel, or HTML files. No manual entry required.

Icon
Embed anywhere

Copy one line of code and paste it into any website, fully responsive.

Icon
Brand control

Add your logo and brand colors. Your tables carry your brand, not ours.

Icon
Quick themes

Design fast with ready-made themes, or make and save your own styles.

Icon
Multiple export options

Download your table chart as a high-resolution image, with easy resizing.

How EasyTABLE works

Get started in three steps

Build beautiful tables in minutes. No spreadsheet formulas, no coding, no design tools.

01
EasyTable: Step 1

Enter your data

Enter your data in manually or import via CSV, Excel, or HTML . EasyTABLE automatically detects your columns and rows.

02
EasyTable: Step 2

Customize your table chart

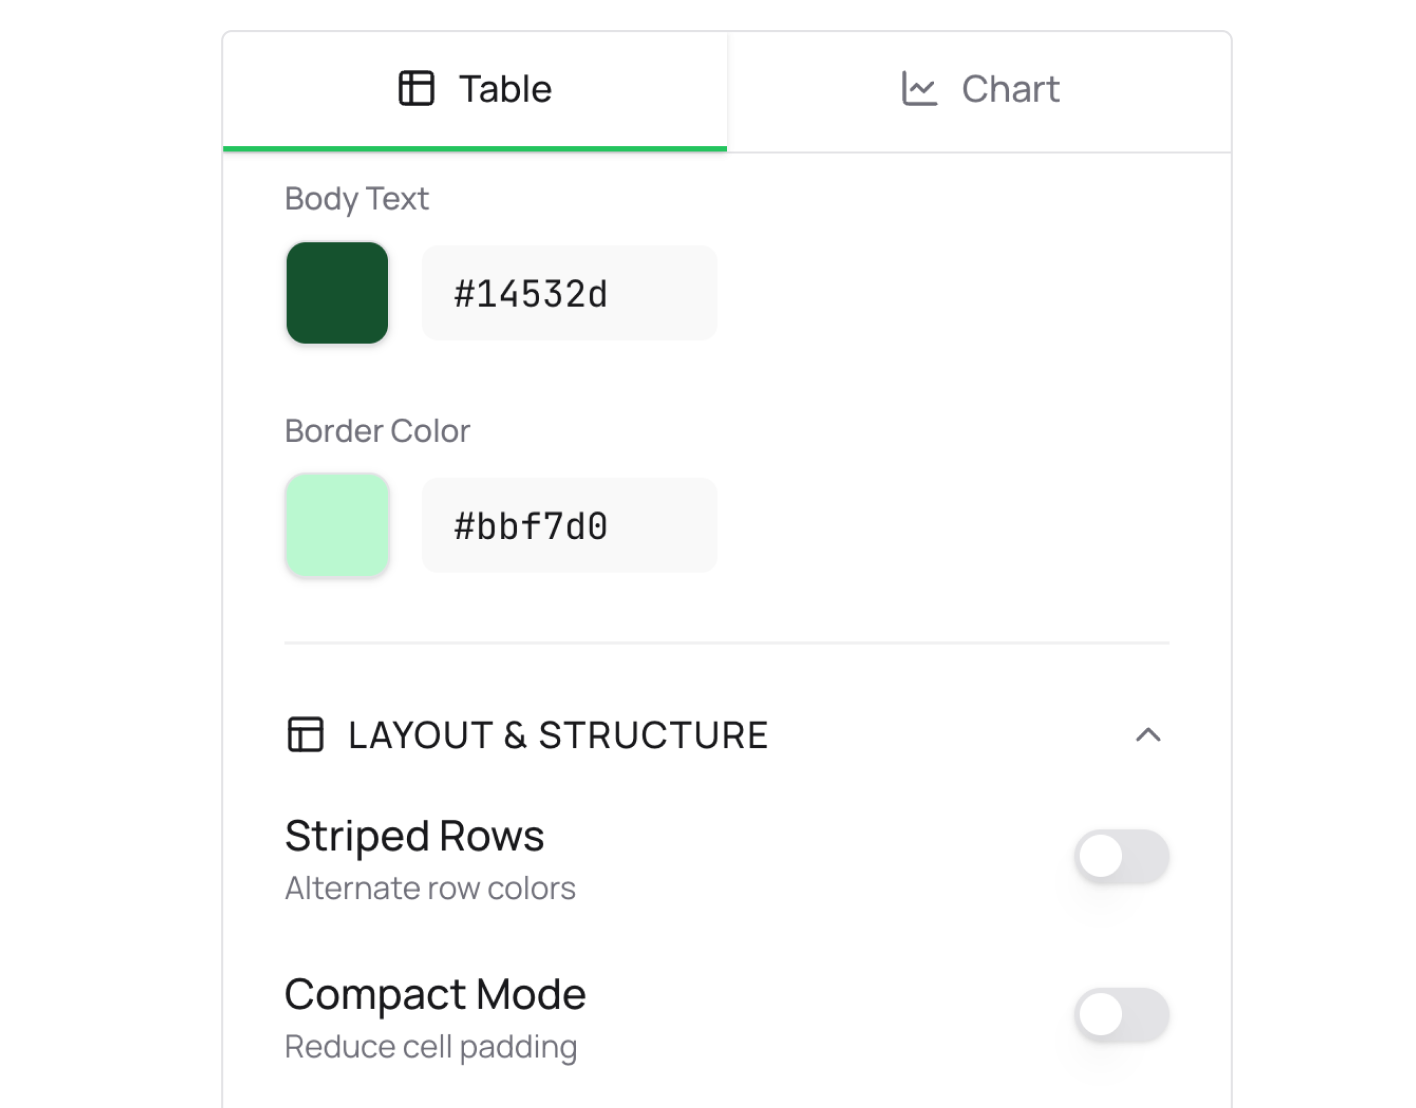
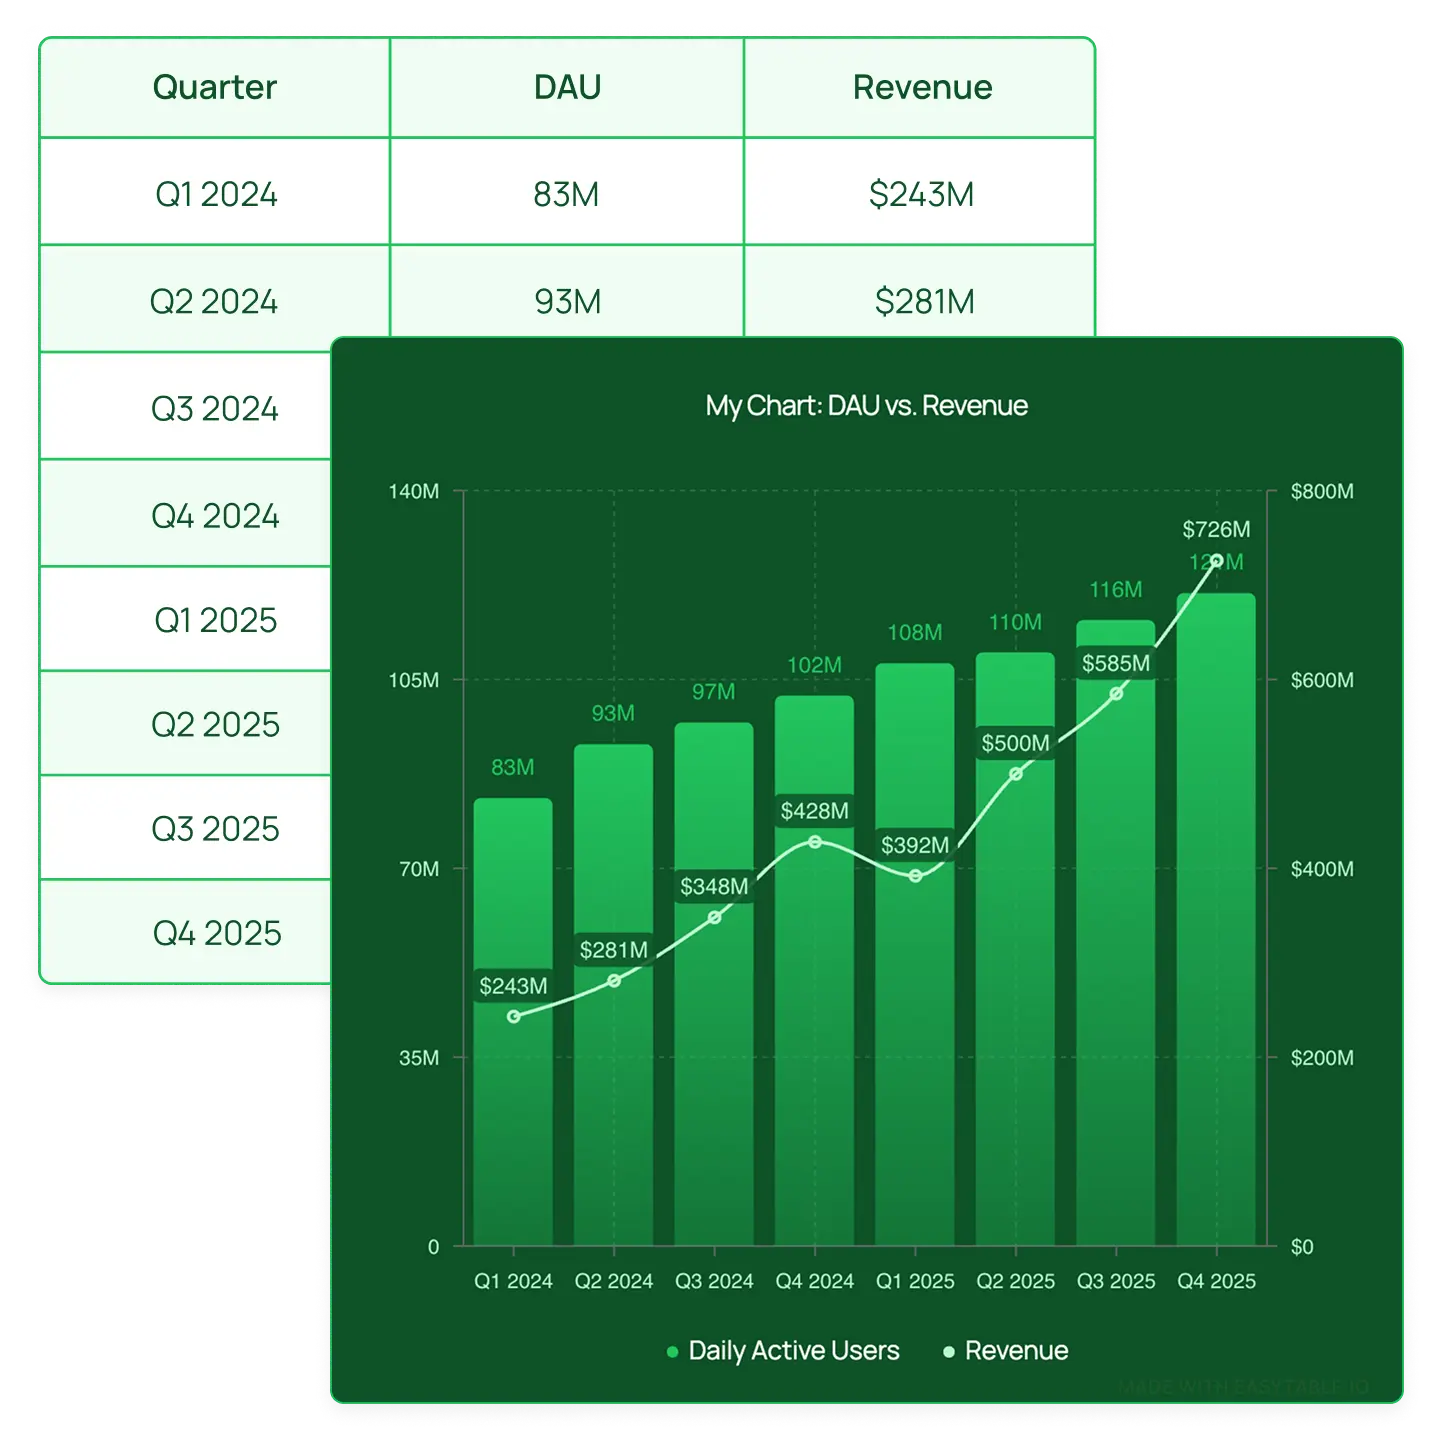
Customize your table with colors, fonts, borders, and alignment. Optionally, toggle on a chart to visualize your data.

03
EasyTable: Step 3

Export or embed anywhere

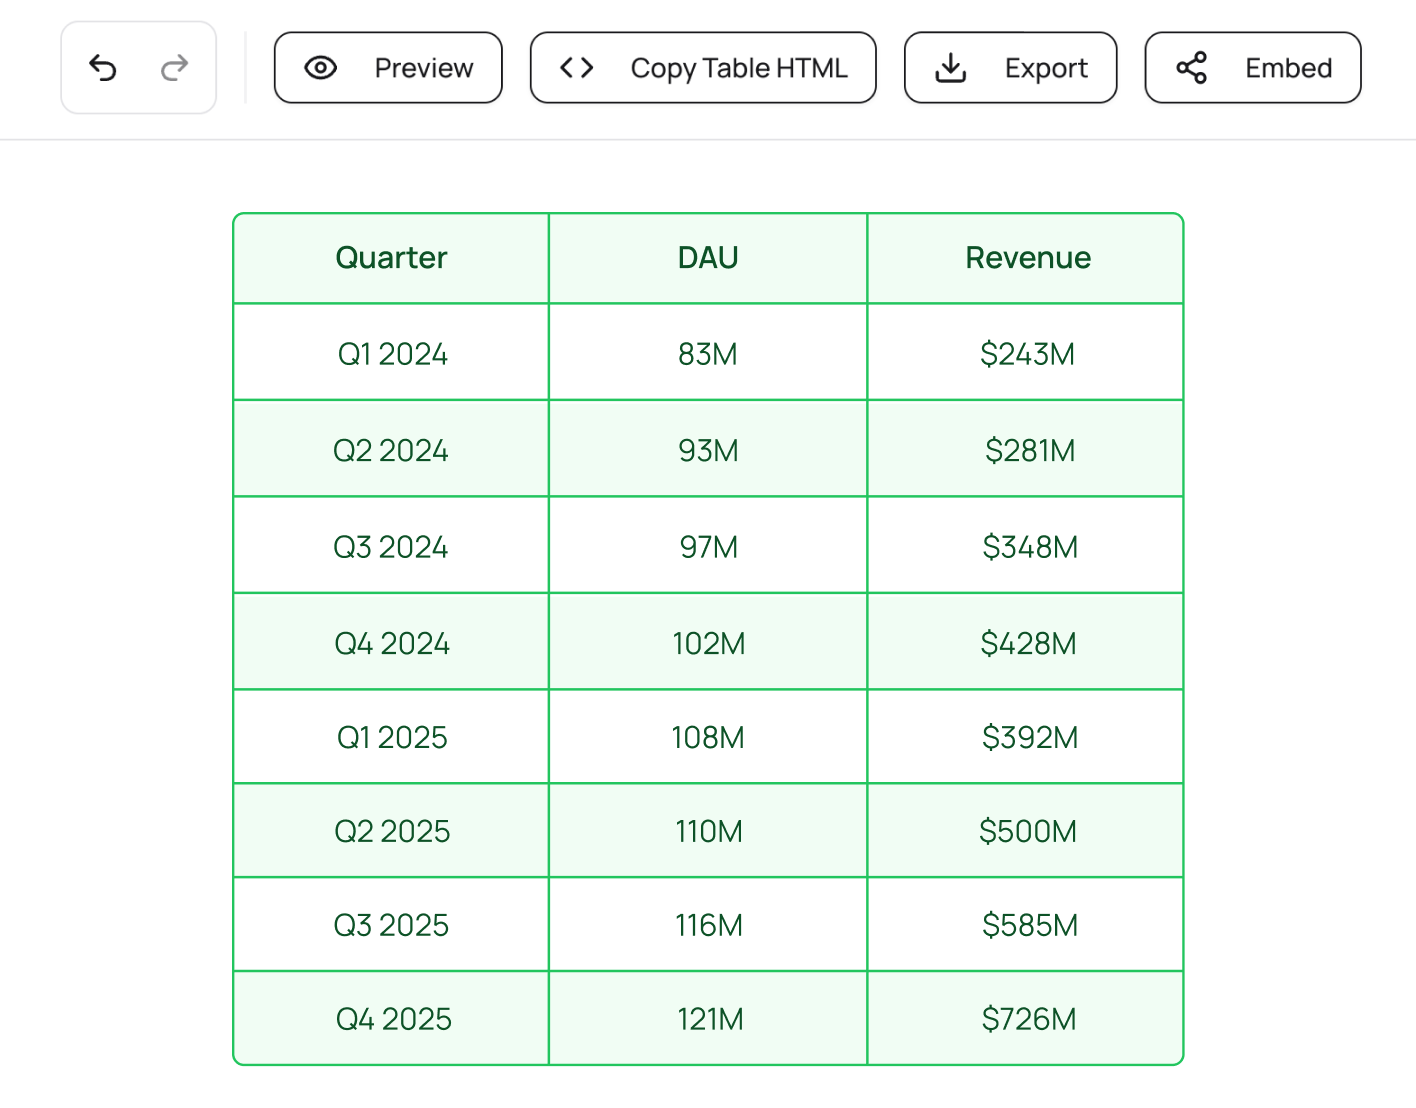
Export your table as a high-resolution image or embed directly on your website for an interactive, fully-responsive experience.

Your data, beautifully displayed anywhere

Try it free

Arrow iconArrow icon

Visual table chart generator

Everything you need to make beautiful charts

EasyTABLE gives you a complete set of tools to create table charts that look professionally designed.

Icon

Import your data: Add your existing data in with one click.

Icon

Brand your content: Your charts carry your brand, not ours.

Icon

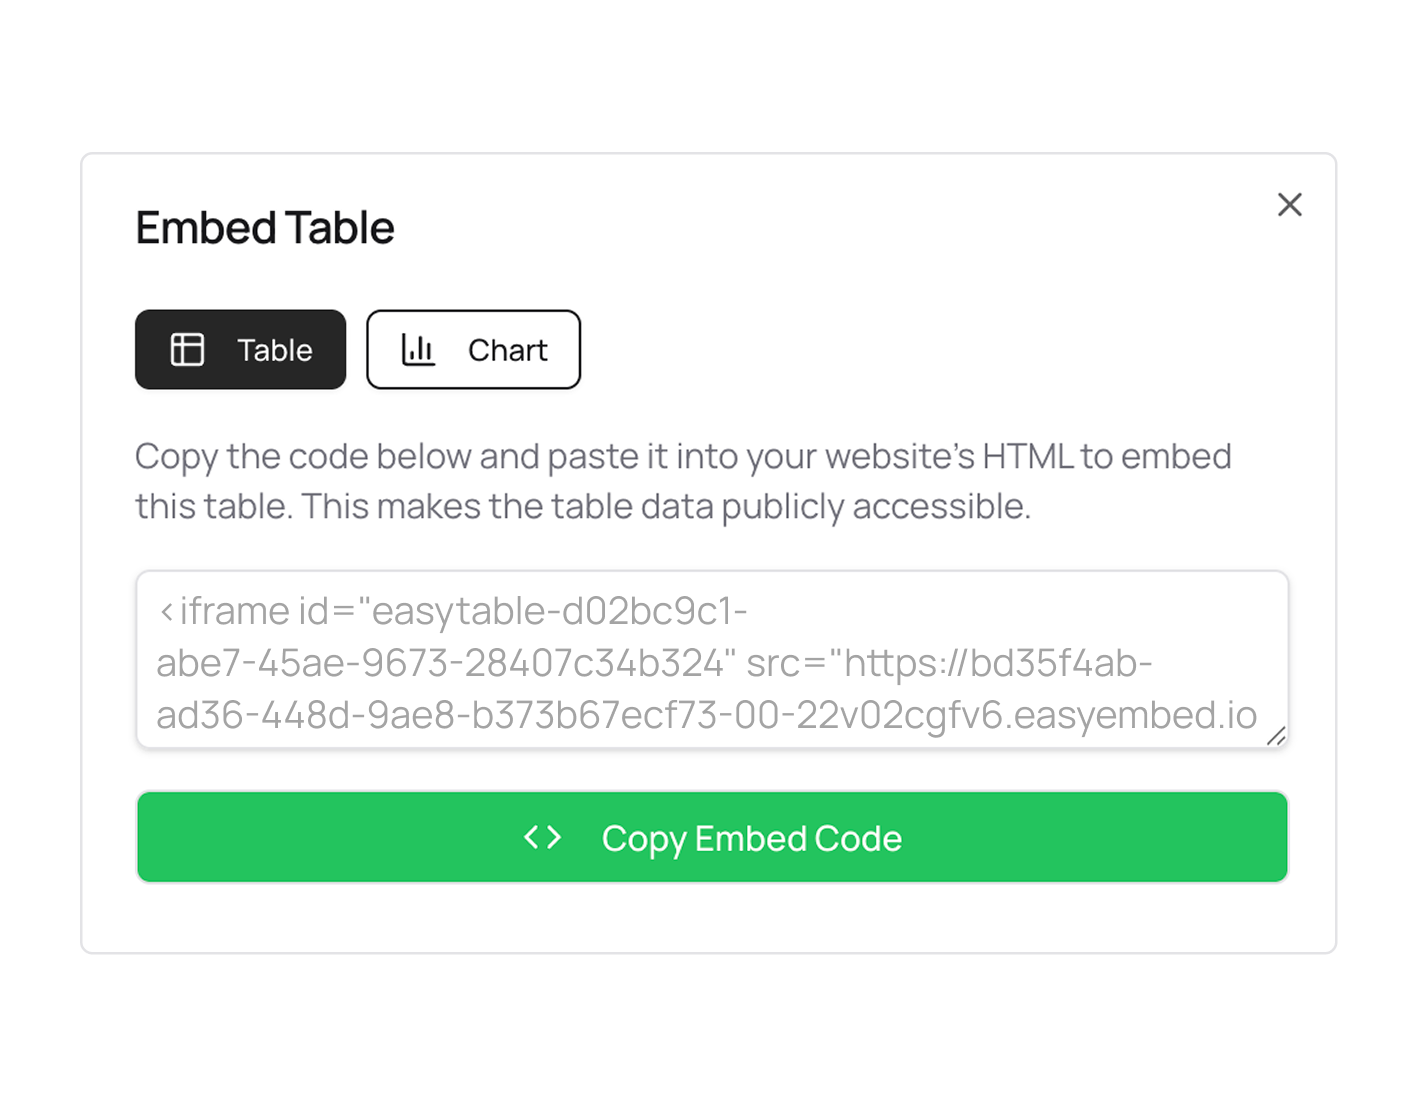
Embed anywhere: Paste your embed code into any website.

EasyTABLE Table & Chart Maker
Icon
Visual table editor

Add rows, columns, and edit cells inline. Style headers, body text, and more.

Icon
Custom styling for every detail

Control header and body fonts, text alignment, padding, and colors.

Icon
Built-in chart visualization

Toggle on a chart and your table data becomes a bar, line, pie, or combo chart.

Icon
Responsive embed codes

Each table and chart gets its own embed code that adapts to any screen.

Icon
CSV, Excel, and HTML import

Bring your existing data in with one click (CSV, Excel, and HTML import support).

Icon
Auto-save and undo/redo

Your work saves automatically as you type: full undo and redo history.

Icon
Duplicate tables

Clone any table to create variations without starting from scratch.

Icon
Export and embed options

Export tables as a high-resolution or embed directly on your website.

Icon
Table themes

Save and reuse chart color palettes and styles across all your tables.

Real-life examples

Table charts for every use case

*Each table below is added as an embed for an interactive experience. But you can also export charts as static images.

EXAMPLE 1

Create comparison tables

Compare products, pricing plans, features, or specs side by side in a clean, styled table with an optional chart visualization.

EXAMPLE 2

Visualize survey results

Turn raw data into polished tables with matching charts that make your findings easy to understand at a glance.

EXAMPLE 3

Publish data in
blog posts

Embed responsive tables and charts directly into your WordPress posts, newsletters, or online reports. No screenshots needed.

Try it free

Arrow iconArrow icon

EXAMPLE 4

Building pricing tables

Create styled pricing comparison tables for your website. Customize colors to match your brand and embed with one line of code.

EXAMPLE 5

Present data in meetings

Download clean, branded table and chart images for slide decks and presentations. No more copying from spreadsheets.

FAQ

Have questions? We have you covered.

Discover how EasyTABLE helps you create beautifully designed table charts for your website.

How do I create a table chart?

What table styling options are available?

Can I turn my table data into a chart?

What chart types can I use with my table?

Can I import data from a spreadsheet?

Can I embed the table and chart on my website?

Can I add my logo to the chart?

Do I need to know how to code?